

The Bottom 50%: The Untold Economic Story
Wealth and asset concentration in the United States, by the numbers.

Analysis and visualizations by Jessica Burbank, all rights retained. Source data from Federal Reserve Board of Directors.
Economic narratives cater to the middle and upper classes, who are majorly the producers and consumers of economic news. Media coverage of wealth inequality typically revolves around the top 1% and 0.1%. The bottom 50% are hardly mentioned.
Infographics and statistics that grace our feeds shape how we see the world. If we’re constantly told wealth inequality is worsening, we believe it. We think the top 1% is getting more wealthy, while the rest of us are getting a smaller slice of the pie. That’s not the real story.
Compared to 1989, do you think the bottom 50% control less of the nation’s wealth, or more?
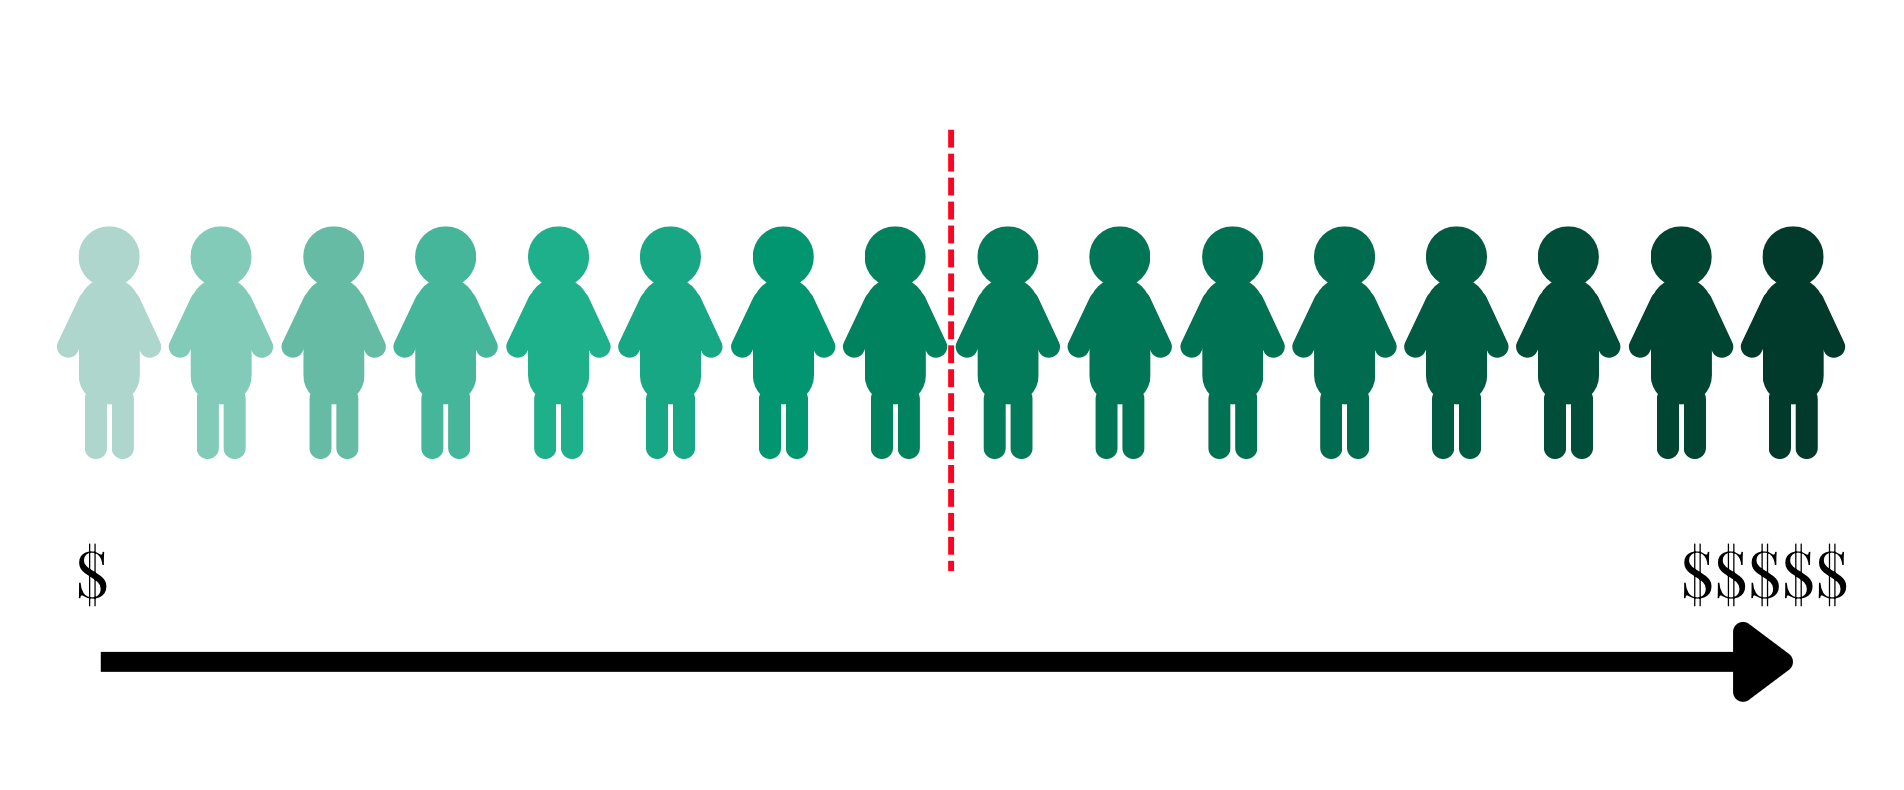
The bottom 50% refers to a wealth percentile—which is less complicated than it sounds.
If we took the entire U.S. population, and lined everyone up in order of who has the least to the most wealth, then cut the line exactly at the middle, creating two groups, the half with less money is the bottom 50%.
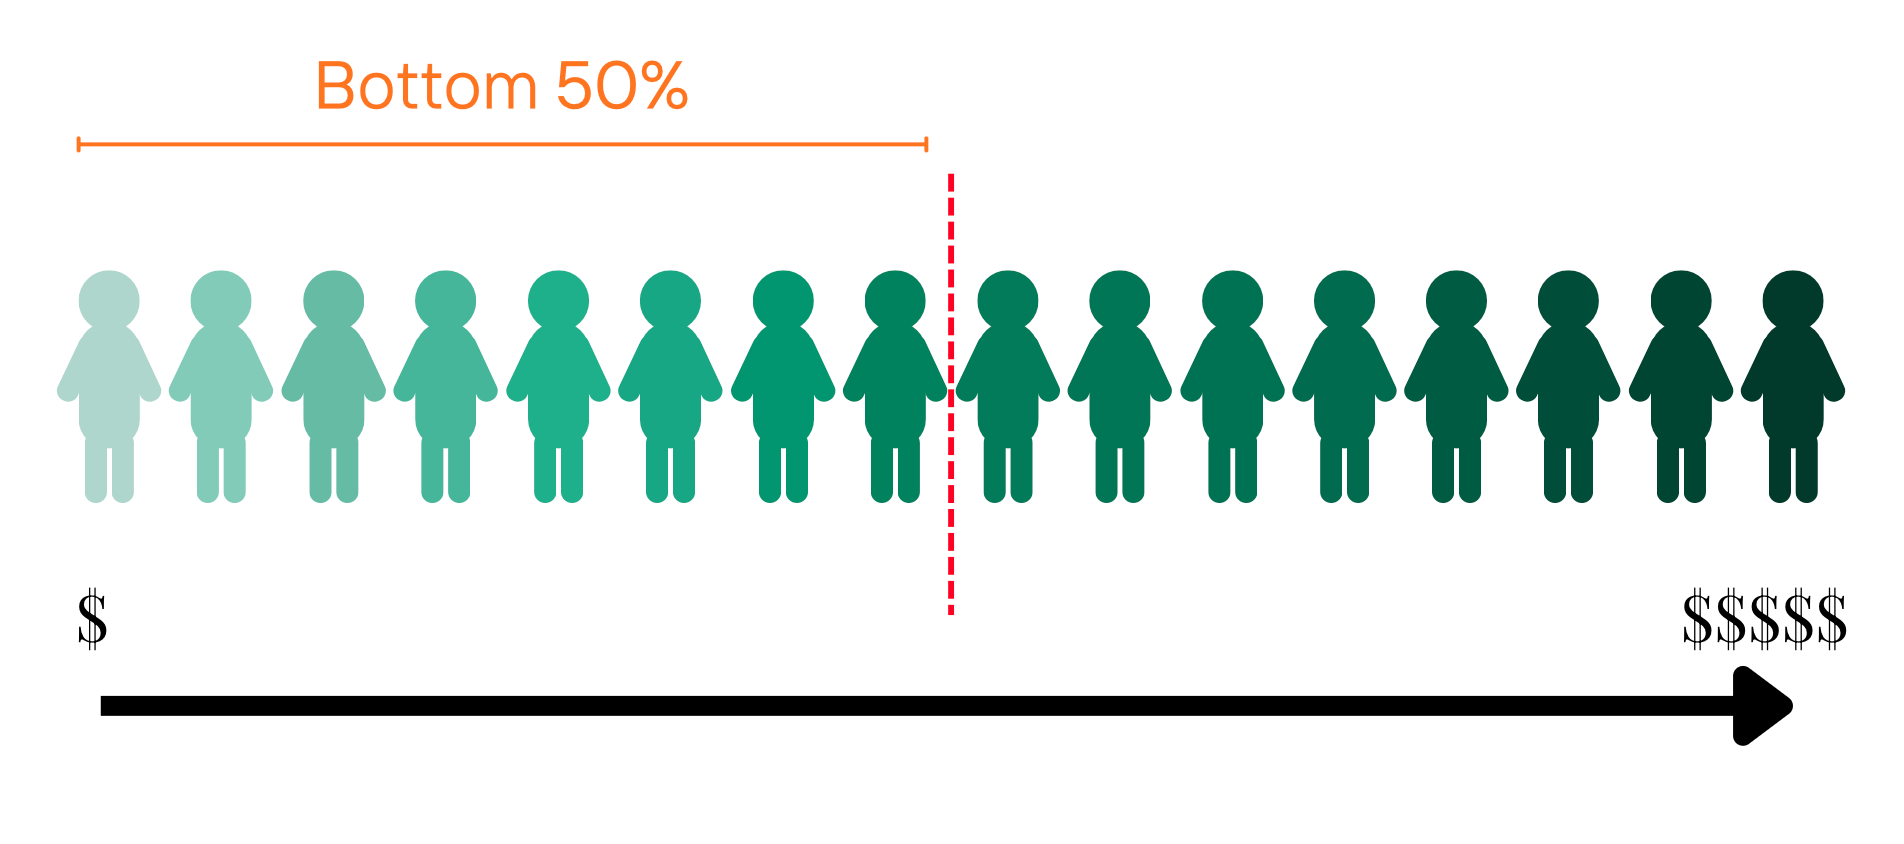
If you guessed that the bottom 50% has less wealth today than in 1989, you are correct. Before I reveal to you how much their wealth share changed, consider: how much wealth should be in the hands of half of the U.S. population? An equal distribution would suggest they control 50% of the nation’s wealth.
It’s definitely less than that.
What percent of the nation’s wealth is in the hands of the bottom 50% of al households? Take a guess. Come up with a number in your mind before reading ahead.
How much of our nation’s wealth is controlled by the bottom 50% in the United States today?
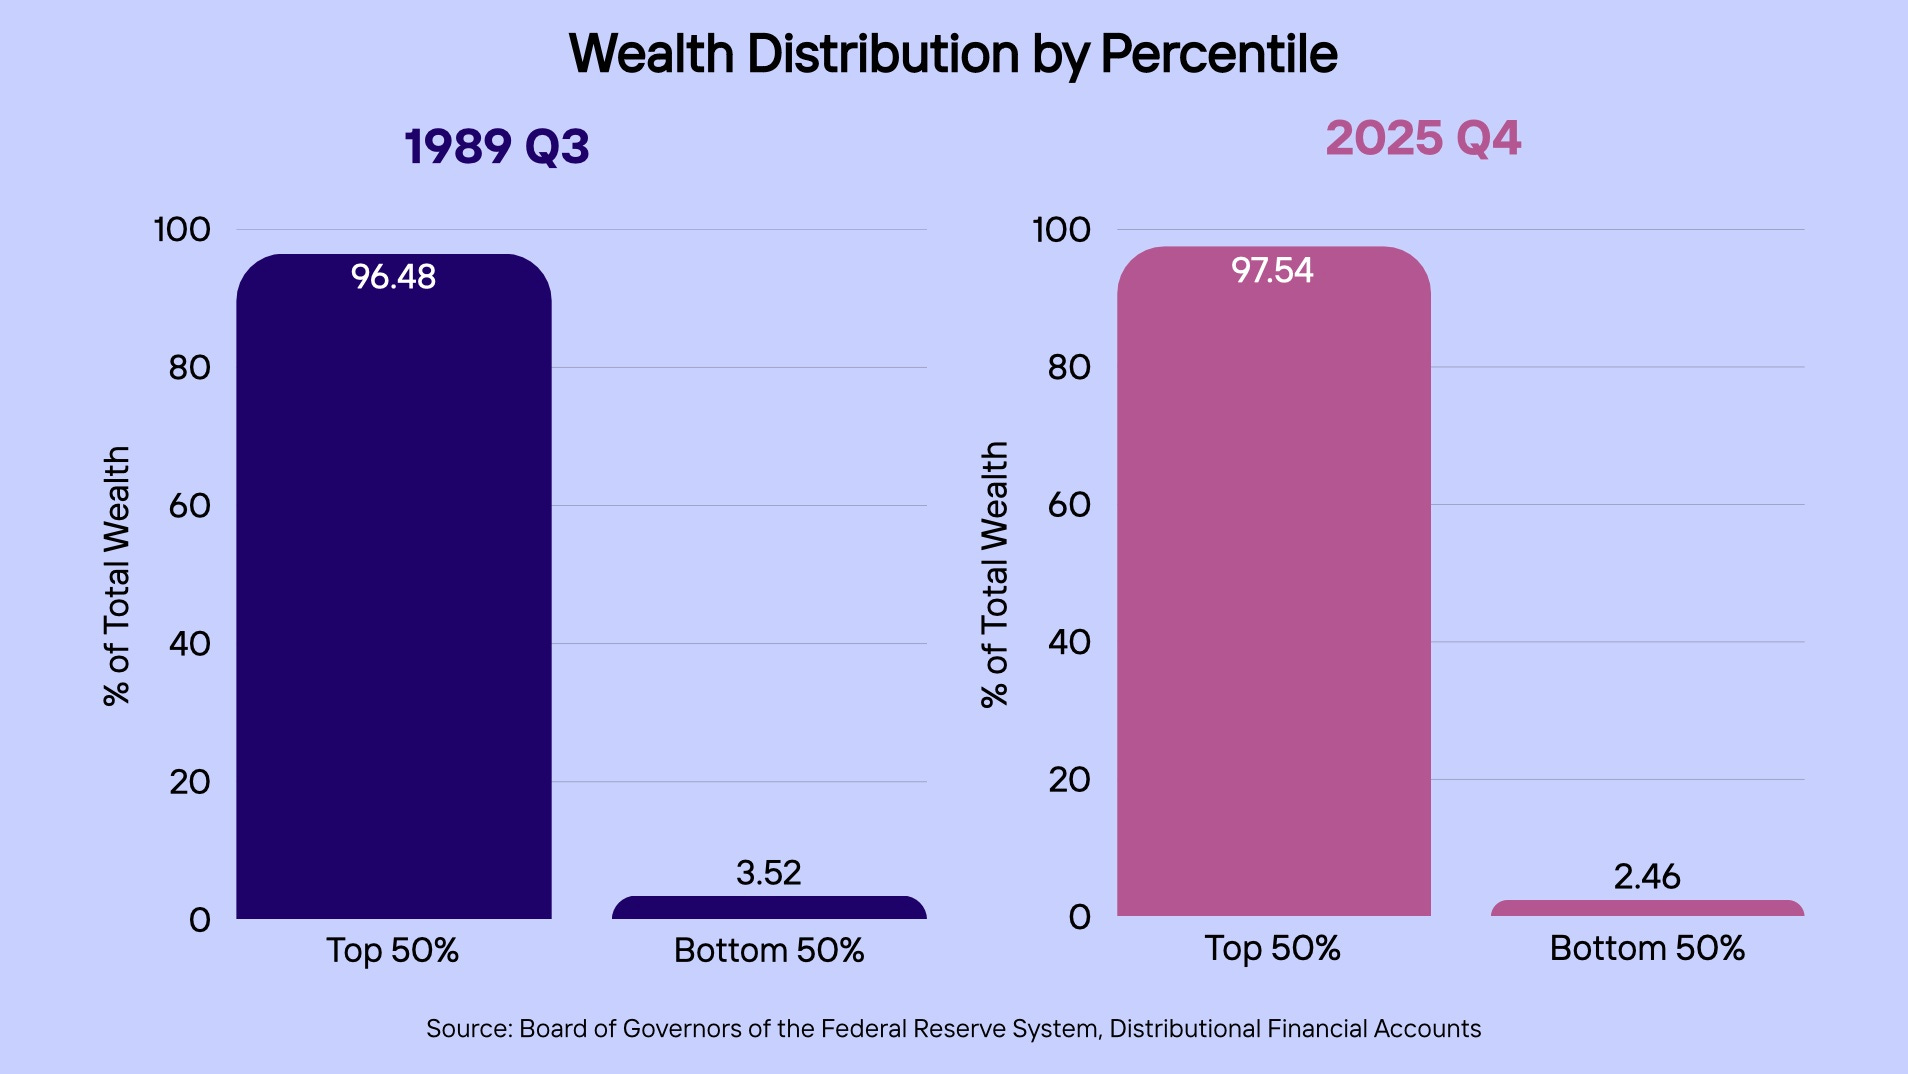
2.46%. That’s it. Half of the population controls just 2.46% of our nation’s wealth.
Give yourself a moment to process that. Really absorb what that means about the current state of the U.S. economy.
If wealth is concentrating in the hands of the richest few, this is probably a smaller proportion compared to a few decades ago.
How much of the wealth share do you think the bottom 50% controlled in 1989?
Think about how the wealth share of the bottom 50% might have changed since Reagan left office. Today it’s 2.46%, what was it 37 years ago?
Ready?
In 1989, the bottom 50% controlled only 3.52% of the nation’s wealth. Over the past four decades, the wealth share of the bottom 50% decreased by precisely 1.06%.
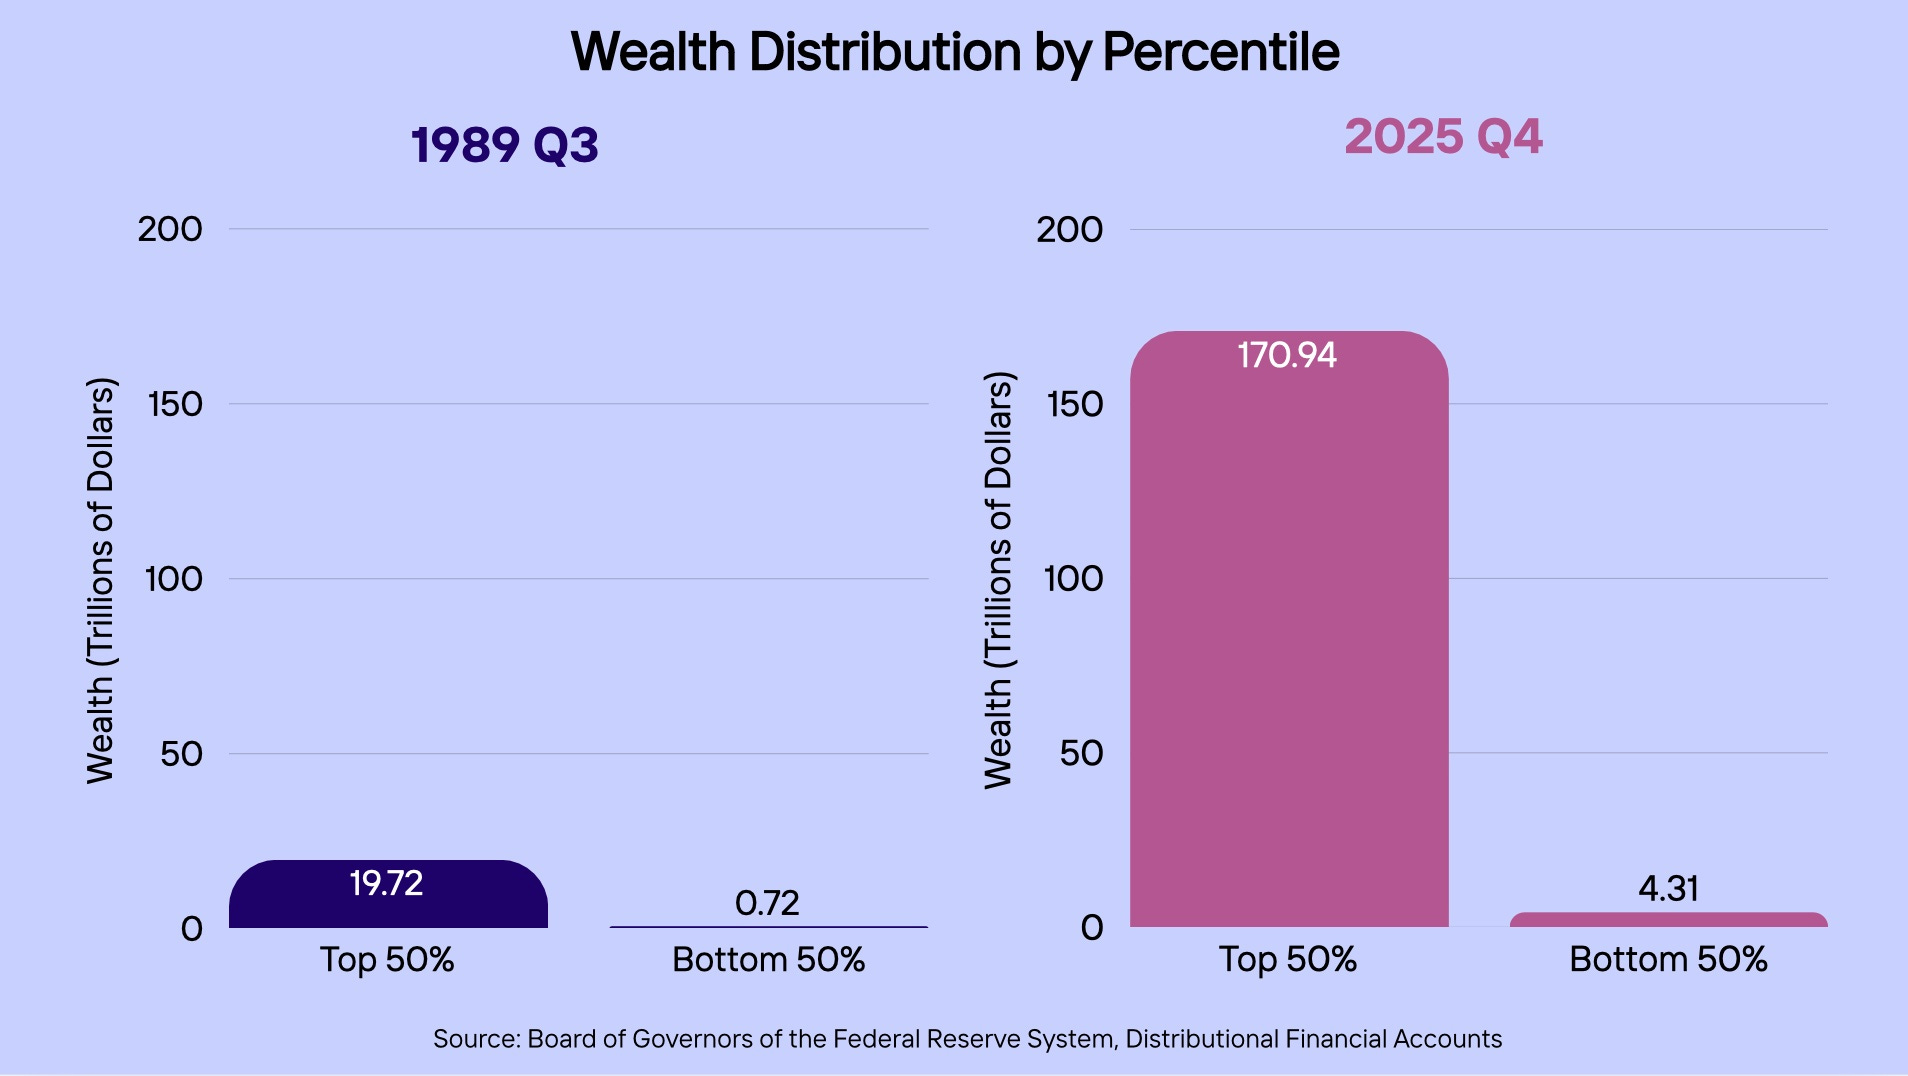
The total wealth in the U.S. economy has increased, but this proportion has remained nearly the same. If we were to just look at raw numbers (total dollars), here’s the wealth distribution compared to 1989:
The top 0.1% has grown their share of the nation’s by about 6 percentage points since 1989.
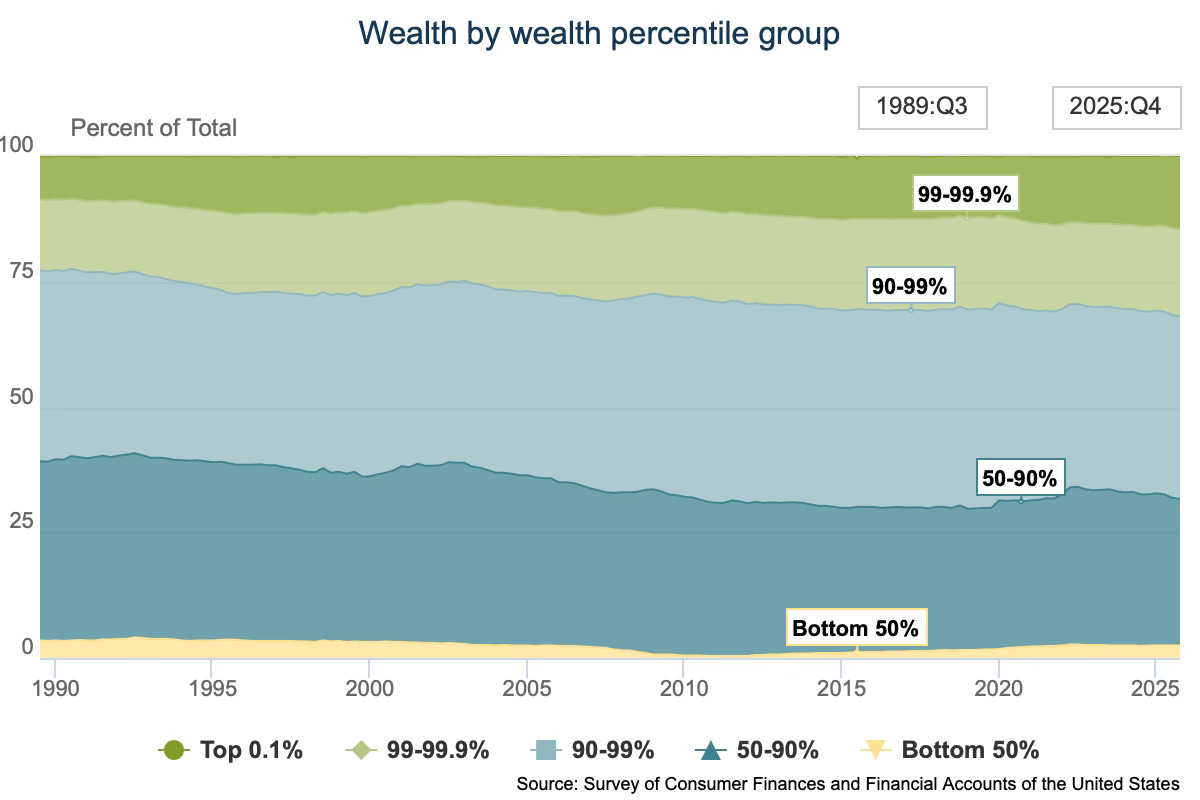
If you’re looking for the bottom 50% on this chart, it’s the little sliver of yellow along the x-axis.
In 1989 Q3, the top 0.1% held 8.6% of the nation’s wealth. As of 2025 Q4, the top 0.1% controls a whopping 14.5%. For context, the minimum wealth cutoff for the top 0.1% is over $46 million (latest data 2022).
The top 1% have grown their wealth share by 9.1% since 1989.
If the bottom 50% only saw a minimal reduction in their wealth share (1%), where did the top 1% pull from?
The wealth share of the 90-99% decreased by 1.6% since 1989 (from 38% to 36.4%).
The wealth share of the 50-90% decreased by 6.4% (from 35.7% to 29.2%).
Dominant narratives suggests wealth is being transferred from the bottom to the top. The data tell a different story. The bottom 50% has hardly seen a change in their wealth share. It’s the middle and upper classes’ wealth share that’s shrinking.
Wealth isn’t necessarily being transferred from the middle/upper class to the top 1%. It’s not even necessarily changing hands from one private household to another.
The U.S. government routinely adds dollars to the economy. If new dollars are created, to fund defense contracts for example, that’s a direct wealth transfer from the government to the owners of defense companies or their stock—these people are typically the top 10%. This would increase their wealth share while not directly syphoning any assets or cash from members of the 90%.
When it comes to wealth distribution, the folks at the bottom 50% are nearly as worse off as they were 40 years ago.
Note: The bottom 50% is much worse off economically compared to 1989 when we consider wage stagnation and affordability. Economic inequality has grown for the bottom 50% if we look at income percentiles (how much money is coming in)—but the focus of this piece is wealth percentiles (net worth or total cash & assets after liabilities).
The Top
The top 10% holds $119.7 trillion in wealth, compared to the bottom 90% with $55.6 trillion (31% of total wealth). When the top 10% controls most of the nations capital (68%), the bottom 90% is cut out of economic decision making.
88% of stocks and funds in the United States are owned by the top 10%—a significant spike compared to 81.8% in 1989. The top 0.1% is responsible for the entirety of that increase: growing their share from 14.8% to 24% since 1989.
The bottom 50% doesn’t own a smaller share of total stocks and funds, since 1989, the bottom 50% actually made gains over the last 40 years, all the way up to 1.07% from 0.96%.
If we remove the top 0.1% from the top 10%, and analyze just the 90-99.9%, we see they saw a decrease in ownership. The 90-99.9% currently own 63.1% of stocks and mutual funds, a 3.9% decrease from the 67% share they held 1989. The upper middle class also saw their share of stocks and fund ownership. The 50-90% now own 11.5%, compared to 17.2% in 1989, a 5.7% reduction.
We live in an authoritarian economy. The top 10% controlling 68% of our nations wealth and 88% of corporate stocks and mutual funds means they decide where capital investments go. This gives them power over which businesses grow, when industries thrive, how products are made, if innovation happens, and what ideas spread.
If we care about the top 10% controlling 69% of the nation’s wealth, or that share having grown by 9 percentage points over the last four decades, we should probably also care that: that growth alone is three times the amount of wealth held by the entire bottom 50%.
It seems the narrative focuses so much on the top 1% and 0.1%, rather than the top 10% or bottom 50%, is because the people who write the articles about economic inequality are typically upper and middle class, meaning they belong to a group with a shrinking wealth share. Their power is waning to the waxing top 1%.
I agree that billionaires have too much power, and wealth concentration by the top 0.1% makes a fair society impossible. The top 0.1% holding $24.89 trillion of the nation’s wealth, while the bottom 50% (a group 500 times as large) only has $4.25 trillion, is a power imbalance that compromises a just economic or political system. The top 0.1% includes just 136,453 total households, compared to the bottom 50% with 68.2 million.
Any media coverage on wealth concentration and economic inequality is better than none, but it’s disappointing this increase in attention is the result of the issue beginning to affect the upper classes. If wealth was more equally distributed among the top 50%, and the wealth share of the bottom 50% was around 10%, I think a lot of economic reporters and political analysts would be fine with that (because a lot of them were).
Anyone who is fine with an economic underclass so long as they aren’t the ones in it is not someone I respect.
Politics
Knowing the economic realities facing the bottom 50% helps us understand the rise of populism. Wealth concentration by the top 1% hasn’t been a talking point that deeply connects with working class people because it isn’t a new problem for the bottom 50%.
This why a populist economic message from Bernie Sanders, who focuses on worker power and social programs, connects more with the working class than a message focused on taxing the ultra-rich. When our tax dollars fund multi-million dollar contracts with McKinsey to address the opioid crisis, when McKinsey also consults for opioid manufacturers, it’s hard to imagine a tax on the ultra-rich will truly benefit regular working people—or if that money will be recycled through the top 50%.
Trump speaking negatively about the upper classes, framing himself as an existential threat to the establishment, was well received by working people upset about economic inequality, even though he belongs to the top 0.1%. One guy from the top 0.1% threatening the power of the top 50% (who keep the bottom 50% struggling) seems better than someone promising to redistribute the wealth of the top 0.1% to the next 49.9%.
Bourgeoise Myths
Because the majority of economic analysts are from upper middle class families, this means they grew up with bourgeoise myths, like the belief that an economic underclass exists because they are simply less capable and less worthy than the top 50%. I’m not interested in reading economic analysis produced by anyone who thinks that way.
As a child of the bottom 50, I know this is how the upper 50 think. I’ve been in the room with them. I went to graduate school with people who think like that. I’ve been mistaken for a member of the top 10% in my classes at Brown and Harvard, and scholars are more honest with classmates assumed to be from the same class. I’ve sat across from top economists who make clear this is an operating assumption they have.
I have a lot of questions for anyone who insists inequality is a natural human condition. What kind of person do you think belongs to the bottom 50%? Are they unwise? Are they incapable of achieving what you have with every comfortability and means of assistance?
Why is the working class never invited to consider solutions to, nor study, systemic issues? In a democratic society, shouldn’t those considerations be had by everyone?
Shouldn’t economic education be available to all members of an economy? Why isn’t it? Why are the trades taught in separate institutions from universities and colleges? Why can a student of finance easily enroll in philosophy or politics classes, but a plumber only ever learns plumbing?
Why not go deeper? Does it crumble the illusion of meritocracy to consider such basic questions?
Why are wages lower for physical labor jobs, despite the work being most essential? Why does a farm worker, who ensures food is available to eat, earn less than a day trader—who only turns money into more for those who already have plenty?
When we consider the value workers contribute to our society, against dollars earned, the crisis of the U.S. economy becomes abundantly clear. Money is severely disconnected from real value. This means that those with the most dollars are not the most valuable. For the upper classes, for the elite, the people born of a fine pedigree, who often associate their value and identity with the money they control, this reality is too sickening to face.
The intentional subjugation of the lower class is the most essential story of economic inequality in America. It’s more than numbers, it’s more than money. It is both a mental and spiritual predicament to see others as less than—it is the moral and ethical crisis that defines our time. People are not less because they have less. People do not deserve less simply because they are unwilling to exploit others.
If this is the first time you’re learning the bottom 50% controls under 4% of our nation’s wealth, I am curious what your reaction is. Please leave a comment below.
If you think more people should be aware of the economic reality of the bottom 50%, share this article.
If you’re curious to explore the latest numbers on wealth inequality, here is a data visualization tool published by the Fed. You can also download the source data to analyze it yourself.
Thank you for reading. For more economic coverage and analysis for the 99%—that doesn’t exclude the bottom 50, consider subscribing to my Substack: