

We Replicated Trump's Napkin Math on Tariffs – It's Worse Than We Thought
The emperor has no clothes. We breakdown the miscalculations behind Trump's tariff plan that might crash the global economy.


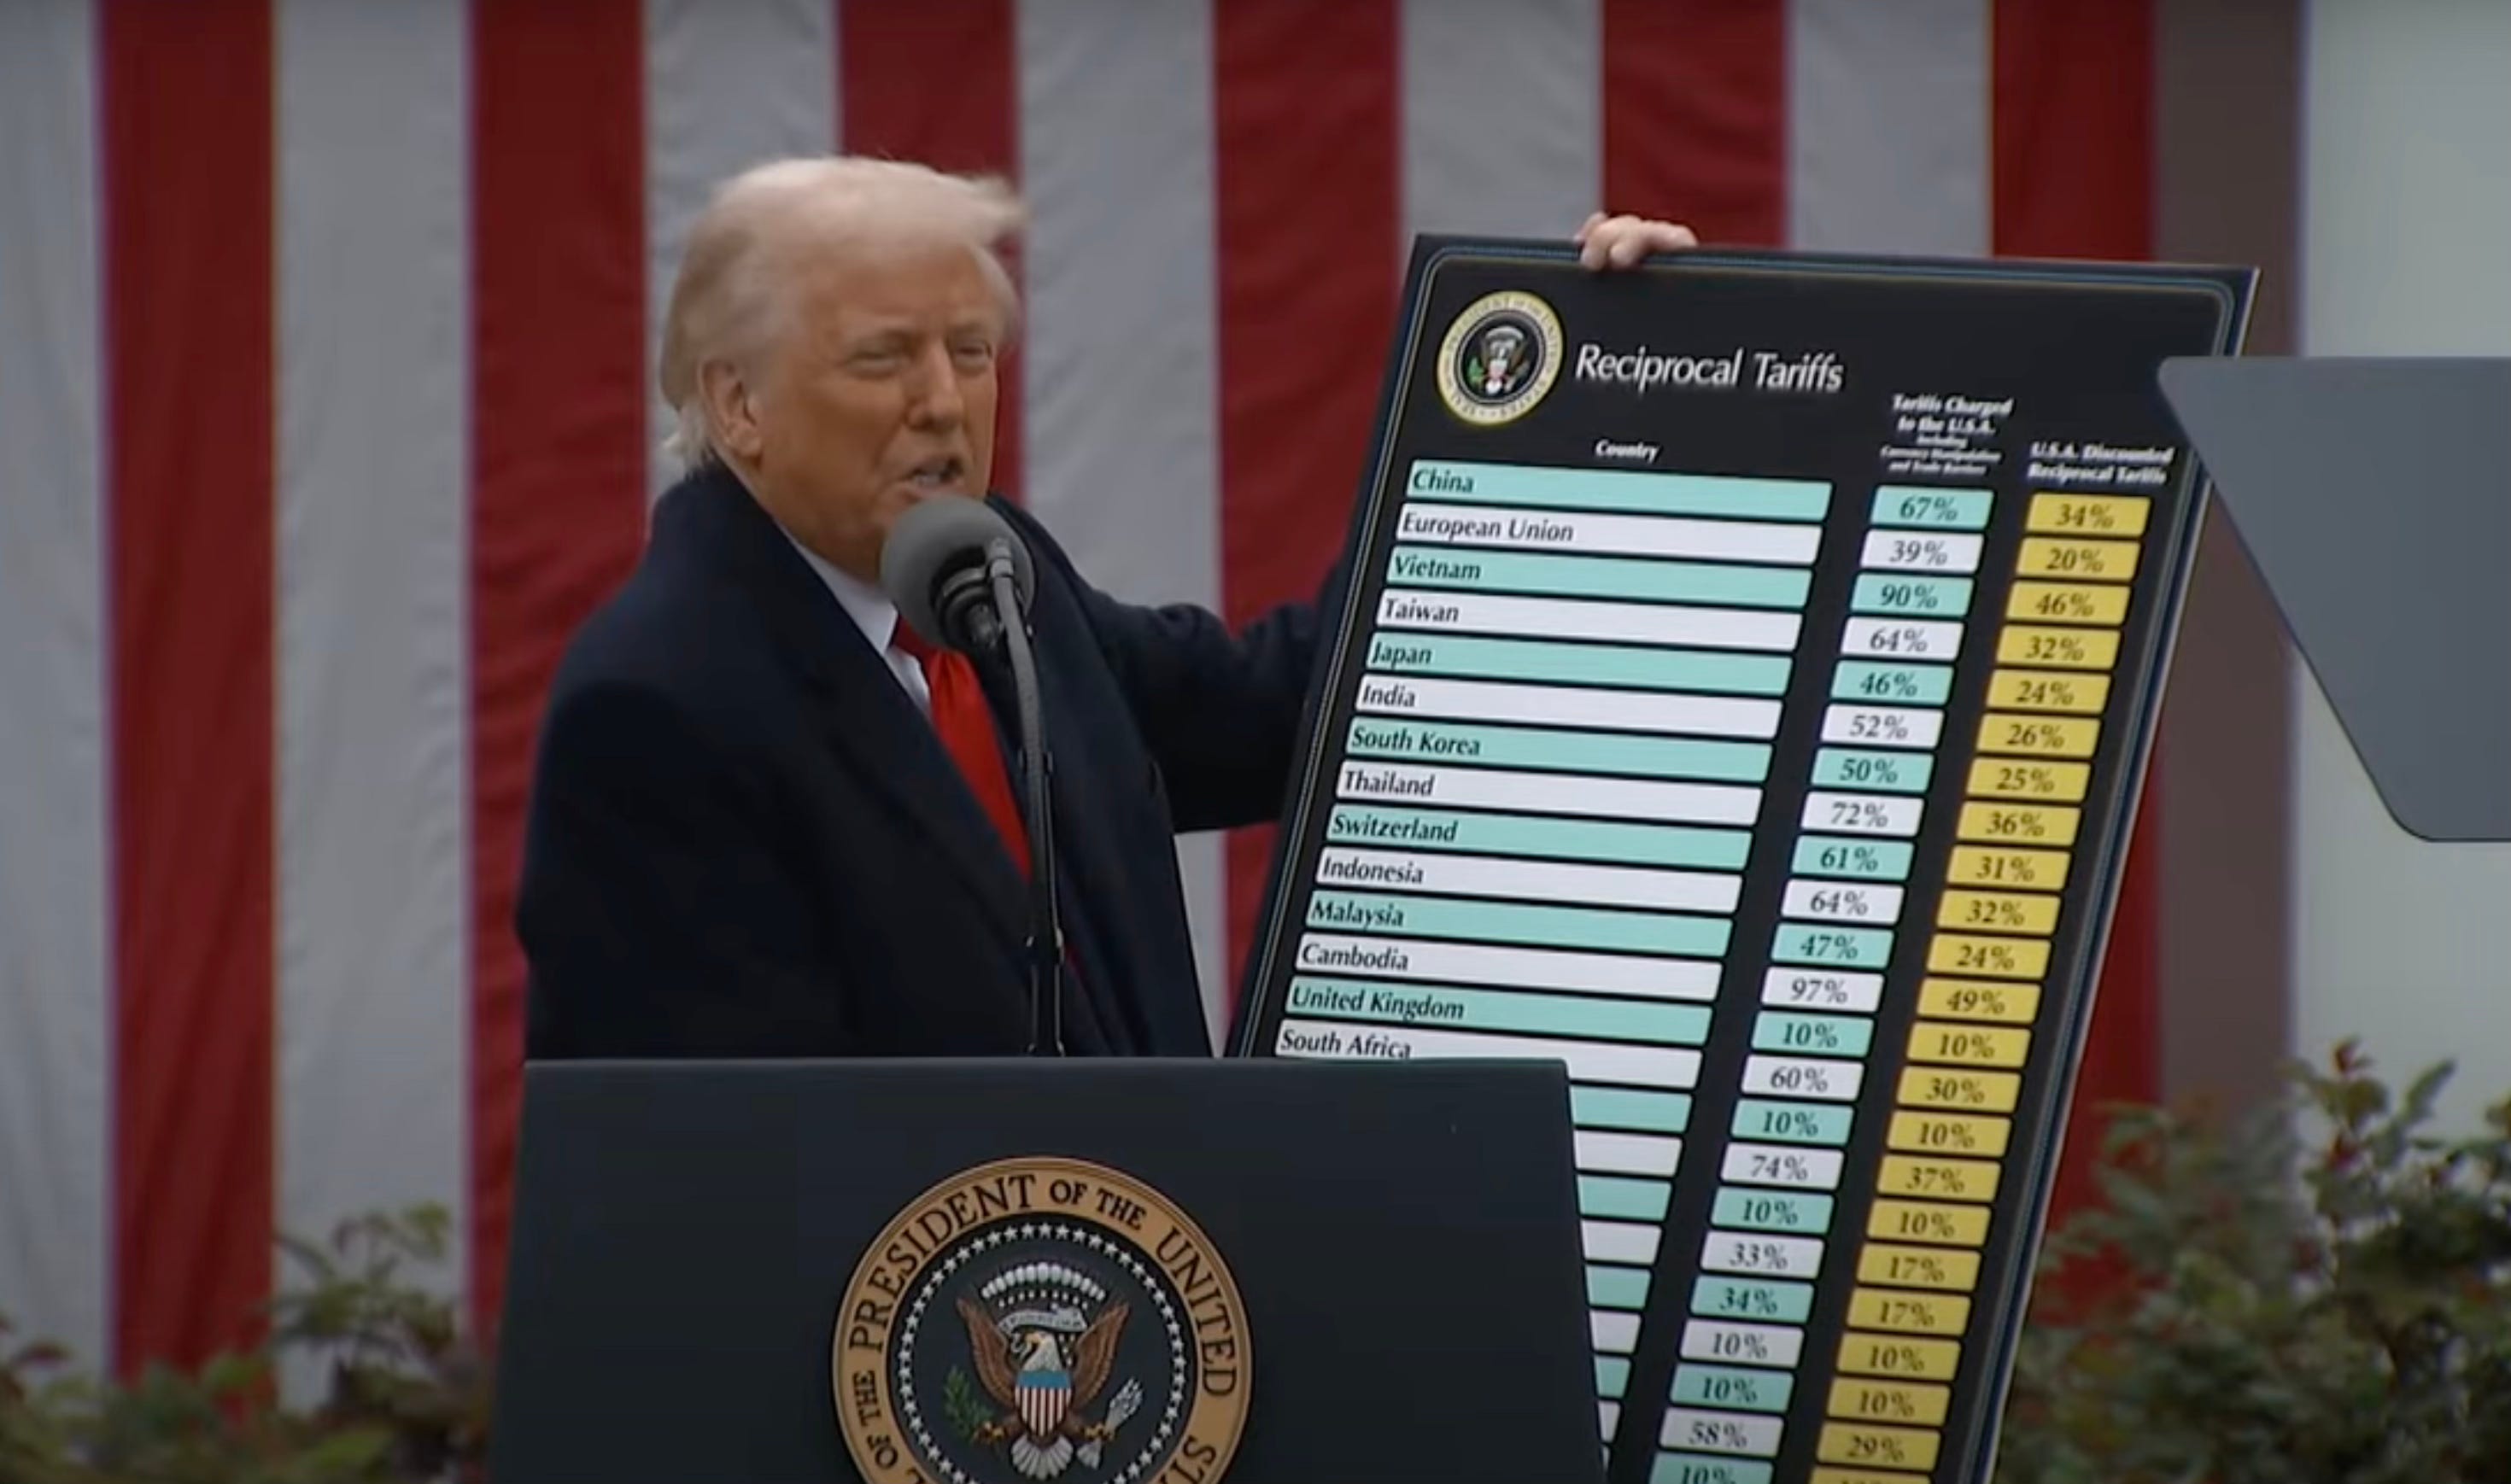
Trump held up a giant iPad-looking screen with a chart of tariffs during his infamous press conference where he imposed tariffs on the whole world. A 10% tariff overall, and massive tariffs on some of the United States’ closest trading partners.
Before the big announcement on April 2nd, Trump had only promised tariffs on all imports from Mexico, China, and Canada. Instead, President Trump shocked the world with eye-watering 34% tariffs on Chinese goods, 20% on those from the European Union, and, for some reason, a 46% tariff on Vietnam?
“April 2nd, 2025, will forever be remembered as the day American in-dus-try was reborn, the day America’s destiny was reclaimed, and the day that we began to Make America Wealthy Again… We are finally putting America First.”
Trump, at the start of his speech, declared April 2nd, “Liberation Day,” and soon after revealed the chart that has sent financial markets into turmoil, and confused the entire nation. The chart featured a list of (most of) America’s trading partners, a supposed estimate of the tariff rates they impose on American goods entering their nations, and the “Reciprocal Tariff” rate that the United States would be imposing on them in retaliation.
For those unfamiliar with the terminology, the phrase “Reciprocal Tariffs” means if X country imposes tariffs on Y country, in response, Y country will reciprocate by imposing tariffs on their import of goods from X. So,if the U.S. imposed a 15% tariff on the import of cars from Japan, then Japan imposes a 15% tariff on the import of U.S. automobiles. Supposedly, Trump’s chart is a list of all of the tariffs other countries currently charge on U.S. imports, and the new tariffs he is levying in response.
The problem is, the column labeled “Tariffs Charged on The U.S.A.” does not actually list tariffs. Instead, the number represents the trade deficit. This is not at all the same thing, although Trump has conflated the two in his speeches before.
While we cannot confirm if he was holding a normal sized iPad and his hands are very tiny, or if it’s just a giant tablet, we can confirm these are not tariffs, and are in fact representative of the U.S.’s trade deficit with each nation(how much more we import from a country than we export to them) divided by the amount we import from them . Then, they took that figure, and divided it in half to arrive at the figures for “U.S. Discounted Reciprocal Tariffs.” We know this, because we replicated the calculation with trade deficit data for the first 50 countries in the chart, using USTR and World Population Review trade data.


Notice that countries the U.S. has a trade surplus with are still hit with the ten percent baseline “reciprocal” tariff, and are shown to have a 10% tariff on the U.S. (Brazil, UK, Singapore, Chile, Colombia, Peru, Dominican Republic, UAE).
To fully break down what this first column means, let’s use the example of Vietnam. Vietnam is shown to have a 90% tariff on U.S. goods. In reality, Vietnam met with U.S. representatives and lowered tariffs the day before this announcement. Vietnam previously tariffed corn and soybeans at 2% and 1%, now 0%. Granted, auto imports are higher at 50%, down from 64%, but still nowhere near 90%.
The U.S. imported $136.6 billion worth of goods from Vietnam in 2024, and Vietnam only imported $13.1 billion in U.S. goods. Does that mean Vietnam is fucking us over? No. Vietnam is a manufacturing hub, the U.S. can afford to purchase a lot of goods from the country, and Vietnam cannot afford to purchase as many U.S. goods – that’s all the 90% figure represents. Do we buy more stuff from them than they buy from us? Yes. Is that bad? No. Here’s why.
Sure, Vietnam gets $136.6 billion, but the U.S. gets $136.6 billion worth of goods. If we didn’t want that stuff, we wouldn’t buy it. If we couldn’t afford that stuff, we wouldn’t buy it. We like stuff! We aren’t going to the clothing store and leaving, thinking, “wow, I gave them $56 dollars for this shirt and they didn’t even purchase anything from my store!”. Because it’s not personal, in the words of Harrison Ford: it’s commerce.

Still, the Trump team took that 90% figure, divided it in half, and imposed a whopping 46% “reciprocal” tariff on Vietnam. Their stupid calculation has us charging crazy tariffs on poor countries who depend on American consumption for their manufacturing industry to function. It’s fucked up, but that’s how it is.
At first, economists and financial analysts pointed out the tariffs column was insane, with figures nowhere near actual tariffs imposed on U.S. goods. Then, internet sleuths figured out that the numbers looked closer to trade deficits. One analyst, James Surowiecki, posted the formula on X, and the fucking Deputy White House Press Secretary replied.

That formula looks sophisticated because it’s in Greek- don’t mind that, most of us learned how to draw triangles in third grade. Just because you call a triangle “delta” doesn’t make you an economist. We don’t need to make this equation complicated. We produced identical results with the simple equation below.


If they truly considered all of the tariff and non tariff factors, and used the complicated “formula” described on the USTR website, why would this simple calculation produce the exact same result every time?
We inspected the webpage for Reciprocal Tariff Calculations on the USTR website, and found that the actual formula is a screenshot from April 2nd. They didn’t even bother to change the name of the file before loading it into the website.
https://ustr.gov/sites/default/files/files/Press/Releases/2025/Screenshot%202025-04-02%20200501.png
Either they have no idea what they are doing, or they are careless in their explanation to the public. They explain their methodology as follows: “To conceptualize reciprocal tariffs, the tariff rates that would drive bilateral trade deficits to zero were computed.” Why would that simply be half of the trade deficit? Why would a poor country like Sri Lanka buy more U.S. goods after a whopping 87% tariff is imposed? Why is driving “bilateral trade deficits to zero” a worthy goal in the first place? The U.S. trade deficit with Sri Lanka is only $2.6 billion. Our trade deficit with Japan is $68.5 billion, but with this formula, Japan’s reciprocal tariff is much lower, at 46%.
It seems possible this whole chart was created by AI, and the USTR formula was reverse-engineered to provide a seemingly-sophisticated explanation for their math. Dominic Preston reported for The Verge:
“A number of X users have realized that if you ask ChatGPT, Gemini, Claude, or Grok for an ‘easy’ way to solve trade deficits and put the US on ‘an even playing field’ they’ll give you a version of this “deficit divided by exports” formula with remarkable consistency.”
The day before “Liberation Day,” April 1st, 2025, was supposed to be the due date for three major reports: one from the Department of the Treasury, one from the Department of Commerce, and one from the Office of the United States Trade Representative. These reports were meant to inform the tariff policy rollout on April 2nd. This requirement was laid out in the America First Trade Policy Memorandum, signed and released by President Trump on his first day in office on January 20th, 2025.
According to the memorandum, the reports would:
“Investigate the cause of our country’s large and persistent annual trade deficits in goods, as well as the economic and national security implications and risks resulting from such deficits, and recommend appropriate measures, such as a global supplemental tariff or other policies, to remedy such deficits.”
However, to date, only one of the three full reports has been made public - the U.S. Trade Representative’s report, which only catalogues some of the tariffs imposed on the United States, in addition to other “barriers to trade,” and does not recommend specific rates for reciprocal tariffs. On April 3rd, the White House published an “Executive Summary” of what is supposed to be a unified report from the three agencies.
However, even this summary only includes “average tariff rates” imposed on the U.S. for five of our trading partners: “the European Union (EU) (5%), China (7.5%), Vietnam (9.4%), India (17%), and Brazil (11.2%).” Compare these to the reciprocal rates on Liberation Day chart - 20% against the EU, 34% against China, 46% against Vietnam, 26% against India, and 10% against Brazil.
All of this bad math, and a misunderstanding of basic macroeconomics, has led to April 3rd, 2025 being the U.S. stock market’s worst day since 2020. However, the tariff imposed on Antarctica, which has a population of 0, has inspired some great memes.


 | A guest post by
|